Biophotonics: Basic Theory of Cancer Development and Defense
by International Institute of Biophysics 2002 (formerly published at www.lifescientists.de/publication/pub2002-05.htm), edited for enhanced readability by Healing Cancer Naturally
At the 11th International Conference “Biological Cancer Defense” in Heidelberg, Germany (May 3-5, 2002), Prof. F. A. Popp presented his basic theory of cancer development and defense. This theory was recently successfully discussed at the Heidelberg Cancer Research Institute (DKFZ) as well. In view of the positive response on the part of the scientists and the highly controversial nature of these ideas at rather clear evidence, we consider it worthwhile to publish a concise review of the substance of Popp’s theory:
Popp started by pointing out that over the last years, cancer death rates have not dropped but rather significantly increased (Fig. 1, [1]), indicating that mainstream science has been pursuing a fundamentally erroneous direction in its attempts at combatting this scourge of humanity. Popp compared this flawed approach with attempts at scientifically answering the question: ”How high is the temperature of a gas?” by proceeding to catch the gaseous molecules and to investigate them under the microscope. While the technique may thus improve step by step to the use of electron microscopy and even higher resolution microscopy, it will forever fail to produce any essential result concerning the gas’ temperature, and not even yield a result clueing the investigator in to the fundamentally erroneous direction of his experiments. Similarly, tumor growth is doubtless nothing but a collective phenomenon of the cell population as a whole. Consequently, the central questions should focus on the control of cell division rate rather than on the molecular properties of individual cells. A basic example which simultaneously provides the starting point of Popp’s theory is cell division, i.e. the mitotic figures (Fig. 2a). As is well known, the molecular content is divided here into two equal parts, where the daughter cells will always contain just half of the entire number of biomolecules without deviations, while the statistical laws require a surplus or undershoot of , where N is the number of molecules. This would always be about 105 molecules more or less in one of the daughter cells.
The fact that practically no aberration takes place can be explained only in terms of a regulating electromagnetic field that stabilizes itself by the interaction with the cell(s). The electric and magnetic biforces take care of the correct movement (and reactions) of all the molecules. Actually, such a field is known and can be calculated. It is the electromagnetic field within conducting and/or dielectric cavities which spreads out over the interior of a cell according to the Maxwell equations.
The field pattern (local field strengths) follows the classical laws of the Maxwell equations, whereas the dynamics is subjected to quantum optics. Fig. 2b shows such a spatial field pattern which has been calculated by taking account of the boundary conditions of a cell. (2). Those electromagnetic quasi-stationary electromagnetic field patterns spread over the wavelength range from at least c. 200 to 800 nm (2). Table 1 shows the series of cavity resonator modes in the optical frequency range. Their superpositions completely explain the mitotic figures both for stationary patterns and in the course of time for the temporal sequence of superpositions. The electrical charges and magnetic momentums of the molecules strictly follow the electric and magnetic field pattern of the corresponding cavitity resonator waves, respectively. As a consequence, the perfect spatio-temporal distribution of molecules can be understood, and it is not wrong to say that it can be understood only in this way.
At the same time one has to expect that an ideal photomultiplier should then register photons outside of the cell population just within this wavelength range of, say, 200 to 800 nm (3). In addition, since these field patterns represent coherent states, the probability of measuring n photons has to follow a Poissonian photocount statistics p(n) = exp (-<n>) <n>n/n!. Both is true (3,4). The evidence of these “biophotons” (which are emitted as single photons by living biological cells and systems satisfy just these conditions) has been shown by Popp’s group since 1976, and it has been reproduced by several other scientists working in the field of biophotonics. We will not repeat the confirmation of all these results, but would like to refer the interested reader to our bibliography (www.lifescientists.de/publication/bibliography1-1. htm or biophotonik.de).
Popp confined his Heidelberg address to the aspects concerning cancer development. Since a coherent field is self-reflective, it follows laws like
t (n) = a n + b n2
where n are subunits of the system (i.e. photons or cells), t (n) describes the time development of n, and a and b are parameters. b must not vanish in order to keep the coherence of the system.
A typical example is the correlation between biophoton emission and cell growth (Fig. 3), where b<0 provides the saturation of cell mass and inhibits overshoot of cell growth, while a>0 is necessary for cell growth stimulation. While a may refer to chaotic components, b is a collective parameter, dependant on integrative properties of the whole cellular system. b as the inhibitor of cell growth is strongly linked to the degree of coherence of the field. Consequently, a definite loss of coherence is a necessary and sufficient condition of cancer development (5,6). The cancer problem is reduced to the investigation of b and b/a.
Actually, Schamhart et. al. and Scholz et. al. have shown that the loss of the validity of equ. 1 and the loss of coherence, which can be expressed in terms of b and a, is strongly correlated to cancer growth (Fig. 4 and Fig. 5, (7,8)). This correlation has the power of a causal relation, since it does lead not only to quantitative, but also to qualitative differences between “normal” cells and “tumor cells” without any exception.
Once we arrived at this stage, we already had a powerful strategy and tool for overcoming the malignancy of cancer development. Where tumor tissue is available (surface tumors or tissue after operation), one may expose the tumor tissue to non-toxic agents and examine whether the biophoton emission will increase or decrease under this treatment. In case of increase (which happens in most cases), the remedy or therapeutic trial under examination is useless.
However, if the application of the remedy (agent) leads to a decrease in biophoton emission, one may assume that its application will result in an improvement of the state and possibly even in healing of the disease. Our experience has shown that in such cases the normal cells which are always present in a real tumor are likely activated into removing or suppressing the tumor cells. This therapy follows just the opposite strategy than the usual tumor therapy. Instead of killing tumor cells (and the connected normal tissue), it stimulates the normal tissue into overcoming malignancy of the entire cell population, in other words into providing b<0 of equ. 1. This may be a physical influence, simply improving the transpararency of the tissue under examination. Obviously, the suitable remedy, which has to be individually adapted to each case, improves the degree of coherence within the tissue under investigation. The same may happen in the well-known cases of cancer going into “spontaneous remission”.
The disadvantage of this therapy consists in the possibility of an operation being necessary to find the suitable remedy. However, Zhang and Popp (9) have shown that to some degree, the loss of coherence can be measured not only by investigating the biophoton emission of either tissue or body (10), but also by statistically analyzing physiological parameters, i.e. resistance (or conductivity) values of the body. Coherence of the regulating fields is strongly related to the log-normal distribution of physiological parameters, a fact that is well known in statistical medicine under the name of “multiplicative “Gestaltungs” principle. As soon as coherence is lost, the log-normal distribution of the skin’s conductivity values turns more and more into a Gaussian distribution. An example is shown in Fig. 6. A German company developed an electrode that enables us to measure hundreds of conductivity values of the human skin in a rather short time. After suitable adjustment of the measurement values the statistical distribution is available and provides a rather reliable indicator of the degree of coherence of the field within the human body. In this non-invasive manner, one may follow rather comfortably both the state of disease and its development under treatment.
In light of new confirmation (11-13), it seems useful to further pursue this theoretical concept and the idea of measuring the degree of coherence of the biophoton field in living systems in order to open the door to the understanding and eventual overcoming of cancer.
References:
(1) Welt am Sonntag Nr. 15, 14. 04. 2002, p. 37: Wissen Medizin, Krebszellen in Schach halten.
(2) F. A. Popp: In: Electromagnetic Bio-Information (F. A. Popp, G. Becker, H. L. König, and W. Peschka, eds. ), Urban & Schwarzenberg, München 1979, pp. 123-149.
(3) F. A. Popp, B. Ruth, W. Bahr, J. Böhm, P. Grass, G. Grolig, M. Rattemeyer, H. G. Schmidt, and P. Wulle: Collect. Phenom. 3 (1981), 187.
(4) J. J. Chang, J. Fisch, and F. A. Popp: Biophotons. Kluwer Academic Publishers, Dordrecht-Boston 1998.
(5) F. A. Popp: In: Recent Advances in Biophoton Research and its Applications (F. A. Popp, K. H. Li and Q. Gu, eds. ): World Scientific, Singapore-London 19992.
(6) F. A. Popp: In: Macroscopic Quantum Coherence (E. Sassaroli, Y. Srivastava, J. Swain, and A. Widom, eds. ), World Scientific, Singapore-New Jersey, pp. 130-150.
(7) D. H. J. Schamhart and R. van Wijk: In: Photon Emission from Biological Systems (B. Jezowska-Trzebiatowska, B. Kochel, J. Slawinski, and W. Strek, eds. ), World Scientific, Singapore (1987), pp. 137-152.
(8) W. Scholz, U. Staszkiewicz, F. A. Popp, and W. Nagl: Cell Biophysics 13 (1988), 55-63.
(9) C.-L. Zhang and F. A. Popp: Medical Hypotheses 43 (1994), 11-16.
(10) S. Cohen and F. A. Popp: J. Photochem. Photobiol. B: Biol. 40 (1997), 187-189.
(11) New Scientists Archive, Feb. 22, 2002: Body talk.
(12) F. A. Popp and Y. Yan: Phys. Lett. A 293 (2002), 93-97.
(13) F. A. Popp, J. J. Chang, A. Herzog, Z. Yan and Y. Yan: Phys. Lett. A 293 (2002), 98-102.
Cancer death rate
number of deaths
blue: men red: women
breast cancer colon cancer lung cancer prostate cancer .fixme-u-g refer original
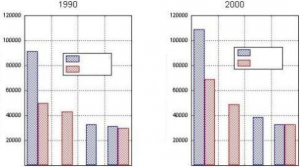
Fig. 1: Since 1990, the tumor death rate in the US has strongly increased.
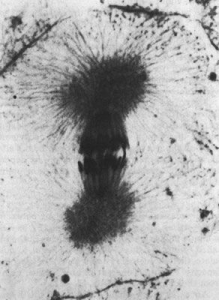
Fig. 2a: An example of a Mitotic Figure of a Cell in a definite stage.
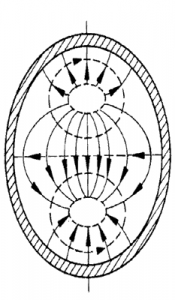
Fig. 2b: The Electric Field of a TM (1,1) cavity mode provides
the field strength that is necessary to establish the mitotic figure of Fig. 2a.
| TE mode mnp |
TM mode mnp |
wavelength l /nm |
| 111 | 690 | |
| 010 | 574 | |
| 112 | 571 | |
| 011 | 546 | |
| 012 | 481 | |
| 113 | 462 | |
| 211 | 438 | |
| 013 | 410 | |
| 212 | 402 | |
| 114 | 379 | |
| 110 | 360 | |
| 213 | 358 | |
| 011 | 111 | 353 |
| 014 | 349 | |
| 012 | 112 | 333. 5 |
| 311 | 323 | |
| 115 | 318 |
Table 1: Cavity Resonator Modes which are stabilized in cells. They are necessary and sufficient for displaying the spatio-temporal dynamics of mitotic figures.
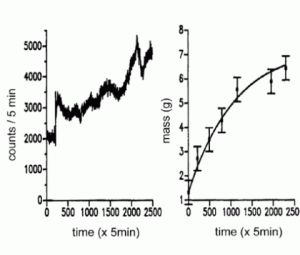
Fig. 3: Emission of biophotons during the growth of seedlings (left) and growth itself (right). There is a strong correlation between cell division rate and biophoton intensity according to¶ /¶ t (n) = an + bn2, where a>0 and b<0.
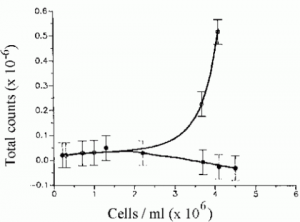
Fig. 4: While the biophoton emission drops for normal cell populations with increasing cell density (lower curve), it increases for cancer cells (upper curve). b turns from a value <0 to one which is >0, as soon as normal cells change into cancer cells (see reference (7)).
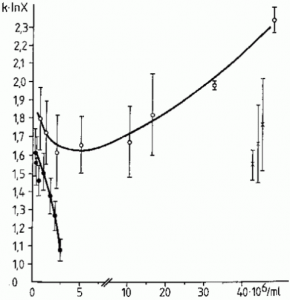
Fig. 5 While normal tissue increases the degree of coherence of the biophoton field with increasing cell density, tumor tissue decreases the degree of coherence of the biophoton field (see reference (8)). The lower curve represents normal cells, the upper curve tumor cells. The ordinate displays a measured value, representing the deviation from ideal coherence, the abscissa the number of cells in the measuring cuvette.
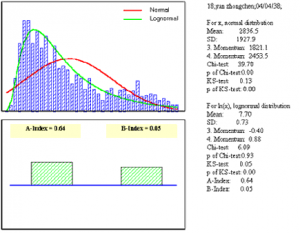
(a)
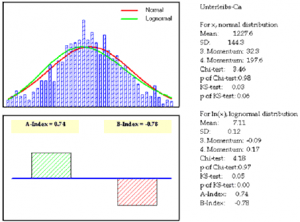
Fig. 6: The distribution of the frequency of measuring definite values of skin conductivity of a healthy person (Fig 6a) and of a cancer patient (Fig. 6b). While the distribution of a healthy person follows a log-normal distribution, the one of a cancer patient turns into a Gaussian distribution, reflecting the coherence and the chaotic state of the biophoton field, respectively.
© International Institute of Biophysics 2002, iib AT lifescientists. de
Recent Advances in Biophoton Research and Its Applications
by F.A. Popp, K.H. Li, Q. Gu 9810208553
Sponsored Links